
Post-industrial economies invest in intangibles to protect competitive advantage

Takeaways
- Australians have a recurring annual intellectual property (IP) deficit of $3.25 billion.
- Australians patent at a very low rate both locally and globally.
- As it stands, Australians are unable to sell into the worldwide knowledge-based economy.
Introduction
Dr Francis Gurry, the Australian Director-General of the World Intellectual Property Organization (WIPO), in a recent speech that he gave in Melbourne, Australia, said that “advanced economies invest more in intellectual capital than they do in physical capital”. As an example, he pointed to Saudi Arabia which is now investing heavily in knowledge to move to an economy that is “sustainable … [and] not subject to the volatilities of a commodities economy”. China, he said, which was once “the factory of the world … [is now becoming] the laboratory of the world”.1
Lecturing on the same point in a series of speeches around Australia in 2013, Dr Gurry described the world-wide shift to a knowledge-based economy. Then, he pointed out that the value of the S&P 500 companies’ assets has flipped since 1978 from being 80% tangibles and 20% intangibles to being 80% intangibles and 20% tangibles. Noting that the centre of wealth creation has shifted dramatically to what the Organisation for Economic Co-operation and Development (OECD) calls knowledge-based capital, Dr Gurry concluded, “competition is increasingly targeted at the competitive advantage that is [given by] knowledge-based capital” and that “knowledge-based capital is expressed as innovation [of course]”.2
In his recent speech, Dr Gurry noted that the spectrum of world economies includes enormous asymmetries in technological capacities. Technology, he articulated, is the great differentiator in history and currently. He highlighted that WIPO’s 189 member states include pre-industrial economies trying to move from subsistence agriculture to commercial agriculture and includes post-industrial economies where knowledge, technology and IP are at the heart of their economic strategy.
Dr Gurry further made the point that knowledge is increasingly the source of wealth generation and that research and development (R&D) spending is an investment in knowledge creation. He pointed out that in 2016, the US spent US$514 billion on R&D which is more than the combined GDP of 167 countries in the world. China invested $400 billion which is more than the combined GDP of 163 countries. R&D expenses for the entire world of $1.95 trillion are the equivalent of Italy’s entire GDP, Italy being the eighth largest economy in the world.
Australia’s R&D outcomes are poorly protected
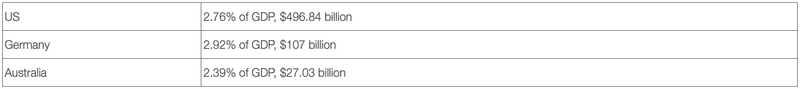
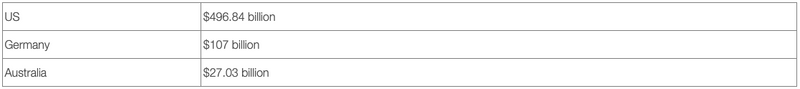
Like all other post-industrial economies, Australia spends a substantial amount of its GDP on R&D. As a percentage of GDP, Australia spends nearly the same amount as the US and Germany on R&D. R&D expenses in 2015 per GDP:
Even though Australia’s R&D expenditures are roughly equivalent to other post-industrial economies, Australia’s economy is saddled with a recurring annual IP deficit of $3.25 billion. As will be clear from the analysis below, unlike other post-industrial economies, Australians do not protect their R&D outcomes to retain the competitive advantage that is typically conferred by innovation in a “value-added economy”. That is, Australians do not capture their innovations as transferrable intangible assets, in particular, patents. IP Australia, in its 2014 report, discussed the recurring annual IP of $3.25 billion:
Australia’s place in the global value chain of ideas is one where the value of IP imports exceeds IP exports, and Australia runs a fairly consistent [annual] IP trade deficit. In 2013, Australian entities paid nearly $4 billion to foreign entities and received $748 million from foreign entities in charges for the use of intellectual property.3
Mark Summerfield in his “Patentology” blog referred to the 2013 IP Australia report:
Australia’s investment in ideas is well below that of leading developed countries. Perhaps the most shocking statistic in the report is that in Australia, the intangible stock of capital is equal to only 4% of tangible assets, whereas in the US it is 91%!4
As mentioned above, Dr Gurry is Australian. Not only is he the head of the WIPO, he is a pre-eminent scholar of the worldwide knowledge-based economy. Given Dr Gurry’s Australian nationality and his thesis statement that “advanced economies invest more in intellectual capital than they do in physical capital”, it appears that the speeches he gives in Australia are actually pep talks in which he subtly cajoles Australians to “get with the program” and invest in intangibles.
Investment in intangibles is obviously required to raise Australia’s 4% intangibles to 96% tangibles ratio to approach the 80% intangibles to 20% tangibles ratio of other post-industrial economies. Innovation in Australia cannot be monetised without a vast improvement in this ratio. Without accumulation of intangible assets to correct the ratio, Australia has nothing to trade in the worldwide knowledge-based economy, and therefore its knowledge-based exports will remain at deficit levels.
The consequence of Australia’s annual IP deficit of $3.25 billion is substantial. Notably, Australia’s total export surplus for 2016 was $3 billion which is smaller than Australia’s annual IP deficit.5 Also, Australia’s recurring annual IP deficit of $3.25 billion is larger than exports of various major industry sectors in Australia. In 2015, wine exports were $1.91 billion and wool exports were $2.21 billion.6 In 2016, Australian dairy exports were $3 billion per year.7 That is, the dairy industry contributes twice as much to the Australian economy via exports than does the transfer of knowledge into the “global value chain of ideas” of all of Australian scientists, engineers, technicians, major corporations, small and medium-sized enterprises (SMEs), universities, government and private research organisations, and entrepreneurs combined.
Australia’s patent filing rate is very low compared to those of its trading partners
The patent statistics of Australia discussed below show that Australia’s position in the global value chain of ideas is precarious, at best. For example, in 2015, Australians filed 2291 patent applications at IP Australia (and 8902 overseas), and non-residents filed 26,314.8 The filings by non-residents at IP Australia accounted for 91% of filings.9 That is, the ratio of resident to non-resident filing is 1:10.
In a compiled list of the top 200 Australian patent assignees (grantees) over the last 20 years, there are only 18 Australian entities.10 Australian assignees holding less than 10% includes half that are Australian universities and government funded research entities. Notably, Aristocrat holds the 5th spot. Commonwealth Scientific and Industrial Research Organisation (CSIRO) is 12th, Cochlear is 16th and ResMed is 60th. In the land grab for IP in Australia, Australians have come up nearly empty handed.
Contrast Australia’s patent filing ratio of 1:10 to that of the US, where in 2015, residents filed 288,335 applications and non-residents filed 301,075, the ratio being approximately 45:55. In the European Patent Office (EPO), residents filed 76,131 applications and non-residents filed 83,897, the ratio being approximately 40:60. These resident to non-resident statistics are radically different than Australia’s.11
Australia’s low ratio of resident to non-resident filings can be explained in one of two ways. First, Australians are not innovative, or second, Australians simply do not patent. Further evidence of Australia’s low patent activity can be seen in numerous contexts. Considering R&D expenditures and per capita statistics provide some insight.
As mentioned above, there is little difference in how much Australia spends on R&D as a percentage of GDP compared to the US and Germany.12 The US and Germany are in the top tier of innovation indices such as Bloomberg’s.13 Dollars spent on R&D per patent in the US and Germany compared to Australia provides a basis for comparison:
As mentioned above, the R&D expenses in 2015 per GDP were:
By comparing the patenting rates of the US, Germany and Australia and their R&D expenditures, it is clear that Australia spends substantially more R&D dollars per patent than does either the US and Germany.
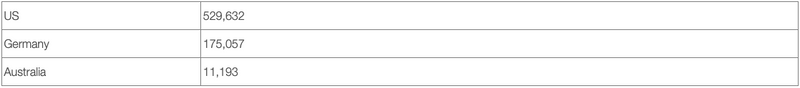
Patenting rates in 2015 (total patent applications filed (worldwide), total count by applicant’s origin):14
R&D expenditures compared to worldwide patent application filing rates for 2015:
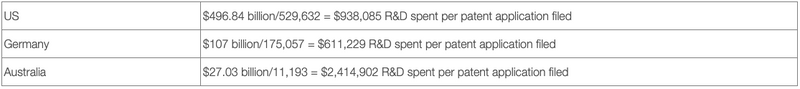
From these numbers, clearly, the amount spent on R&D per patent filed by Australia is substantially higher than the US and Germany.
- Australia spends 2.5 times the R&D dollars spent per patent application as does the US.
- Australia spends 4 times the R&D dollars spent per patent application as does Germany.
Australia’s lack of patent activity can also be seen in the number of patent applications filed per capita:15
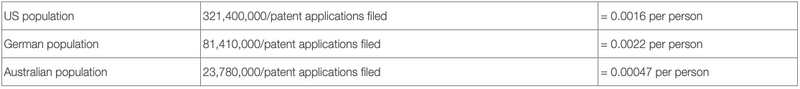
- The US files per person 3.4 times as many patent applications as Australia files per person.
- Germany files per person 4.7 times as many patent applications as Australia files per person.
Whichever way one looks at it, R&D dollars spent or per capita filing, Australia substantially lags behind both the US and Germany in both of these measures.
If patent applications filed were the measure of whether R&D dollars are well spent, it might show that Australia’s R&D dollars are not well spent because problem solving is what earns patent protection. Does that mean that Australia’s R&D is not solving nearly as many problems as does the R&D of the US and Germany? Is it that Australia is not innovative or do Australians simply not patent?
Patent activity is high in leading companies
The United States Patent and Trademark Office (USPTO) publishes a list of the top 1000 patent assignees (grantees) yearly. Four Australian entities are on the 2016 list, Aristocrat, Cochlear, ResMed and CSIRO.16 These Australian entities occupy the following slots in the list of companies who obtained the most US patent grants in 2016:17
- Ranked at 618, Aristocrat Technologies obtained 59.
- Ranked at 688, Cochlear obtained 53.
- Ranked at 779, ResMed obtained 47.
- Ranked at 853, CSIRO obtained 42.
Notably, while Australia has 7.23% of the population of the US, it occupies only 0.4% of the list. This data supports the conclusion as discussed above that Australia seriously lags behind top tier innovative countries in patent activity. It is telling that US companies occupy 50% of the positions on that list. Nine out of the top 20 are American companies.
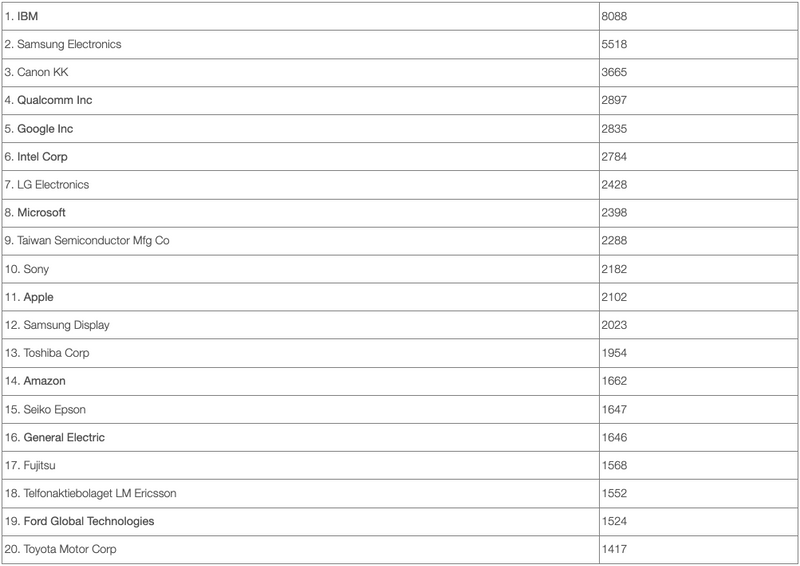
In his recent speech, Dr Gurry noted that the world’s five biggest corporations by market capital are US tech corporations: Apple, Alphabet (Google), Microsoft, Amazon and Facebook. As can been seen by the list above, four of the five are in the top 20 US patent assignees list in 2016 and obtained thousands of patents each. Facebook came in at number 86 with 442 grants.
While Facebook does not generate as many patents as the other four of the world’s five biggest corporations by market capital, Facebook buys substantial numbers of patents from other companies. For example, in 2010, Facebook bought Friendster which included a portfolio of seven patents and 11 patent applications for $39.5 million.18 In February 2012, Facebook bought 750 patents from IBM.19 In April 2012, Facebook bought 650 patents from Microsoft for $550 million, paying $856,000 each.20 In 2014, Facebook acquired at least 100 patents from other companies.21 Whether generating, buying, selling or licensing, the world’s biggest corporations are highly engaged in patent activity.
Other examples of patent activity involving technology transfer transactions are found online, however, companies do not routinely publicise these transactions. Conveniently, RPX Corp has a published list of many transactions.22 One well-known transaction was in 2011 when Google purchased Motorola for its 17,000 patents and 7500 applications for $12.5 billion and then sold the operating company to Lenovo for $2.5 billion, keeping the patent portfolio. Because Motorola had $3 billion cash on hand, the sale meant that Google paid $4 billion for the portfolio which is greater, on its own, than the size of Australia’s IP deficit. That also means that Google paid $163,000 for each patent and patent application, irrespective of its quality. Considering each one would have cost between $10,000–$30,000 to write, file, prosecute and maintain, the return on each patent was substantial.23
Dr Gurry in his recent speech described a Chinese company which grew up in its local market and has begun to build an export business. He said that:
[Shuame is] the largest manufacturer of smartphones in China. It’s got an extraordinary domestic market. Now they’re moving to export markets. But there are a number of accusations that they may, I underline “may”, have copied technology to develop the smartphone on the local market. They have just purchased 1500 patents from Microsoft.24
This purchase is the way in which Shuame can proceed to export markets as a patent portfolio provides defence as well as offense. Facebook utilises the same strategy.
Australia’s patenting rate is stagnant while worldwide, patenting rates are accelerating
Another facet to this same story is that Australian’s patenting rate has not changed in 20 years. In 1995 and 2015, the resident applications per million population for Australia were 99 and 96 respectively. There was an increase to 137 at its peak in 2006, but the rate has steadily declined since then to a very low 96.25
Contrast the same statistics for Germany and the United States. In 1995, Germany and the US filed 467 and 466 respectively. In 2015, Germany and the US filed 887 and 897 respectively. The two-fold increase for Germany and the US is in line with the increase of patent activity worldwide.26
Dr Gurry, also pointed out that in 2015, 2.9 million patent applications were filed worldwide and that the growth rate was 8% for patent applications over the previous year. Spectacularly, the growth rate for trade mark applications was 15%. He contrasted that with the growth of the worldwide economy in 2016, which according to the International Monetary Fund (IMF) was 3% worldwide and 1.6% for the advanced economies. Clearly, worldwide accumulation of intangibles is rising at a much faster rate than that of worldwide economic growth. The fact that Australia’s low patenting rate is stagnant and is not growing like the rest of the post-industrial economies leaves Australia in a precarious position of being left out of the fast-growing knowledge marketplace. As it stands now, Australia cannot engage in the worldwide knowledge-based economy as a seller. It can only be a buyer, and so its deficit will persist.
One has to question whether the four Australian entities that are on the top 1000 US patent assignees list, Aristocrat, ResMed, Cochlear and CSIRO, attract more innovative Australians than the bulk of Australian companies. It can be argued instead, that these four Australian entities have fostered a patent culture which promotes a keen awareness of IP opportunities. That is, they have educated their staff to consider IP issues in their daily work.
Australia’s economy has historically been commodities based. There are efforts in the Australian Government, particularly by Innovation and Science Australia (ISA) to motivate innovation in Australia. However, unless patenting is promoted along with motivating innovation, Australia will not have a knowledge-based economy. Patents are the backbone of technology transfer agreements, which as mentioned above, Australian universities understand,27 but Australian businesses do not.
Ian Maxwell, an adjunct professor at Royal Melbourne Institute of Technology (RMIT) University, wrote in 2014 that Australia’s 20 largest corporations have just 3400 patents between them. At that time, 13 of them had less than 20 patents in total.28 Needless to say, all but three Australian companies, Aristocrat, Cochlear and ResMed, do not have strong patent cultures.
Conclusion
In his recent speech, Dr Gurry reminisced that in 2008, then Chinese Premier Wen Jiabao told Dr Gurry that “intellectual property will be the basis of competition in the future”.29 Foreign entities including Amazon understand this given that, as mentioned above, they file 91% of patent applications filed at IP Australia and own over 90% of Australian IP. It has been highly reported that Amazon is coming to Australia and that Australian retailers are quite concerned about Amazon’s arrival. It is noteworthy that Amazon’s retail competitors such as JB Hi-Fi, Harvey Norman, Wesfarmers and Woolworths hold no patent portfolios to speak of.30 Australians may learn a very hard lesson when Amazon finally starts up business in Australia. Not only will Amazon change retail in Australia through its use of technology, but the Australian business community will be shocked when it figures out that Amazon will also be in a position to shut down or at least severely impair Australian retailers and logistics operators with its large Australian patent portfolio which, of course, has been designed to protect its competitive advantage. Australians patenting could prevent this in the future.
Footnotes
- F Gurry, “Knowledge, Property and Power” speech delivered at the Australian Institute of International Affairs (AIIA) Victoria Melbourne, Australia (17 November 2016) https://www.wipo.int/about-wipo/en/dgo/. Dr Gurry noting the geopolitical rise of Asia provided the following statistics: In 2015, in terms of international patent applications under the Patent Cooperation Treaty (PCT), Asia now files 43% of all PCT applications, wherein China alone files 13.5% and Japan alone files 20%. The EU (an extended Europe) files 28% wherein Germany alone files 8.3% and the US files 26% of all PCT applications.
- F Gurry, “Re-Thinking the Role of Intellectual Property” speech delivered at the University of Melbourne (22 August 2013) www.wipo.int/export/sites/www/about-wipo/en/dgo/speeches/pdf/dg_speech_melbourne_2013.pdf.
- IP Australia Australian Intellectual Property Report 2014 (2014) 26 www.ipaustralia.gov.au/sites/g/files/net856/f/intellectual-property-report-2014-low-res.pdf.
- M Summerfield, IP Australia Delivers Mixed Report Card on Australian IP, 5 May 2013, https://blog.patentology.com.au/2013/05/ip-australia-delivers-mixed-report-card.html.
- M Robin “Australia celebrates record trade surplus as exports boom” The Sydney Morning Herald 2 February 2017 https://www.smh.com.au/business/the-economy/australia-celebrates-record-trade-surplus-as-exports-boom-20170202-gu3t09.html.
- Australia, available at https://oec.world/en/profile/country/aus/#Exports.
- Dairy Australia Australian Dairy Industry In Focus 2016 (November 2016) www.dairyaustralia.com.au/Industry-information/About-Dairy-Australia/~/media/Documents/Stats%20and%20markets/Australian%20Dairy%20Industry%20In%20Focus/Australian%20Dairy%20Industry%20In%20Focus%202016.pdf.
- World Intellectual Property Organization, WIPO IP Statistics Data Center, February 2017, https://www3.wipo.int/ipstats/.
- IP Australia Australian Intellectual Property Report 2017 (2017) 8 www.ipaustralia.gov.au/sites/g/files/net856/f/ip_report_2017.pdf.
- Intellectual Property Government Open Data 2016, available at https://data.gov.au/dataset/ds-dga-6a40d5a7-5886-4a96-8bca-9260ec4479ed/details.
- Above n 8.
- Research and Development Statistics, available at www.oecd.org/innovation/inno/researchanddevelopmentstatisticsrds.htm.
- M Jamrisko and W Lu, These Are the World’s Most Innovative Economies, 17 January 2017, https://www.bloomberg.com/ — where Australia is ranked at 18th, Germany is ranked at 3rd and the US is ranked at 9th.
- Above n 8.
- List of countries by population (United Nations), available at https://en.wikipedia.org/wiki/List_of_countries_by_population_(United_Nations).
- Recall they are on the compiled list of top 200 Australian assignees — above n 10.
- IFI Claims Patent Services, Top 1000 US Assignees for 2016, 9 January 2017, https://www.ificlaims.com/rankings.htm.
- L Gannes, Facebook Buys Friendster Patents for $40M, 4 August 2010, https://gigaom.com/2010/08/04/facebook-buys-friendster-patents-for-40m/.
- D Levine and A Oreskovic, Facebook Buys 750 Patents from IBM: Source, 22 March 2012, https://www.reuters.com/article/us-facebook-ibm-patents-idUSBRE82L13O20120322.
- S Ovide and G A Fowler “Facebook buys AOL patents from Microsoft for $550 million” The Wall Street Journal 23 April 2012 https://www.wsj.com/articles/SB10001424052702303592404577361923087607762.
- G Anders “Facebook buys 100 patents to spur virtual reality, video, speech” Forbes 2 September 2014 www.forbes.com/sites/georgeanders/2014/09/02/facebook-buys-100-patents-tied- to-video-printing-and-speech/#3a8f0676b94a.
- RPX Corp 2014 Patent Marketplace Report (2014) www.rpxcorp.com/wp-content/uploads/sites/2/2015/03/RPX_2014_Patent_Marketplace_Report.pdf.
- J Roberts, Google paid $4B for patents: why the Motorola deal worked out just fine, 30 January 2014, https://gigaom.com/2014/01/30/google-paid-4b-for-patents-why-the-motorola-deal-worked-out-just-fine/.
- Above n 1.
- Above n 8. These statistics are available on the WIPO statistics page where WIPO keeps patent data for each member country.
- Above n 22.
- Australian universities typically have commercialisation offices.
- A Kohler, Australians Need to Get Patenting, 4 December 2014, https://www.abc.net.au/news/2014-12-04/kohler-australians-need-to-get-patenting/5937370.
- Above n 1.
- AusPat, available at http://pericles.ipaustralia.gov.au/ols/auspat/quickSearch.do.